|
|
|
|
|
|
Why do so many traders fail? It is not because they are not smart; it is because they haven't follow through the same trading strategy. Most traders have above average IQ, but they couldn't avoid trading disasters. How to prevent uncontrollable events from causing devastating trading losses? Investors should follow up consistent trading strategy. To prevent the same trading errors from happening again, we recommend 4T (wait, hunt, shoot and profit) stock trading strategy. You can identify the 4 stages of trading stock by following signals generated by ASTSS (Amazing Stock Trend Signal Software). If you have been following through this strategy consistently, you should have improved your trading dramatically.
Here we list some tradings to show how ASTSS can help you to improve your trading. These trading examples were prepared in November 2013.
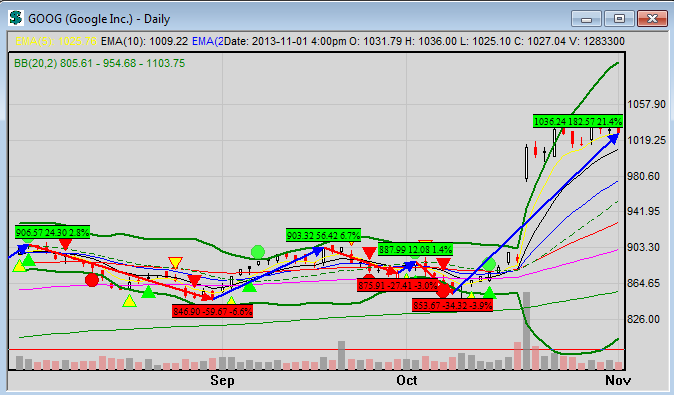
What stocks to buy when the stock market trend is reversed from down trend to up trend? Most investors are confused. One strategy is to buy those bellwethers.
This chart is from August 2013 to October 2013. If you followed ASTSS signals to trade this stock, you would be very happy. ASTSS alerted buy signal on October 14, 2013. If you bought this stock at the close price $876.11, now your profit is 17% as of November 11, 2013 (closed at $1027.04)!
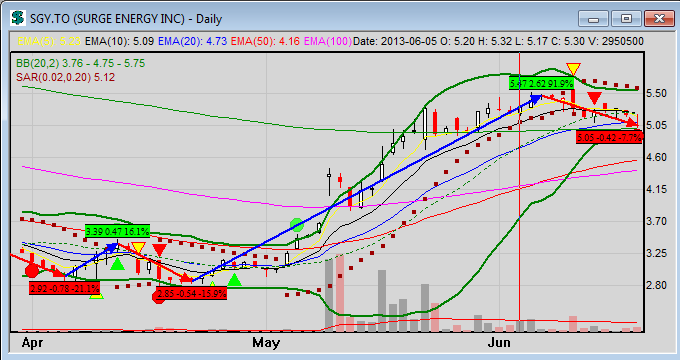
This chart is from April 2013 to June 2013. If you followed ASTSS signals to trade this stock, you would be very happy. ASTSS alerted buy signal on May 6, 2013. If you bought this stock at the close price $3.45 and sold it at close price $5.26 on June 14, 2013 when ASTSS alerted stock trend down signal, your profit was 52%!
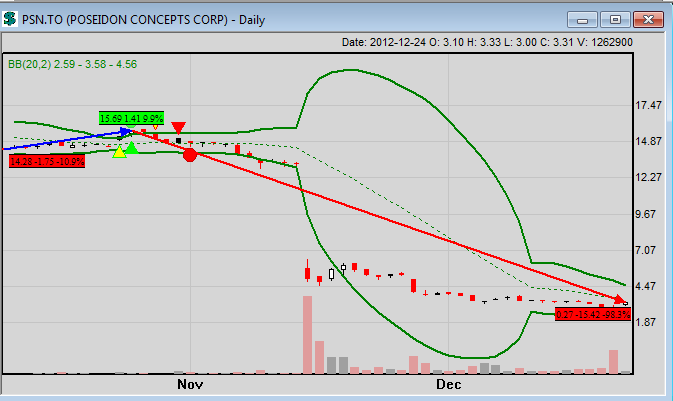
This chart is from November 2012 to December 2012. ASTSS signals guaranteed that you had avoided this disaster stock. (1) ASTSS alerted sell signal on November 1, 2012 when the stock price was at $14 level. It dropped 62% on November 15, 2012! (2) ASTSS didn't alert any up trend signal or buy signal thereafter. This helped you not to buy it.
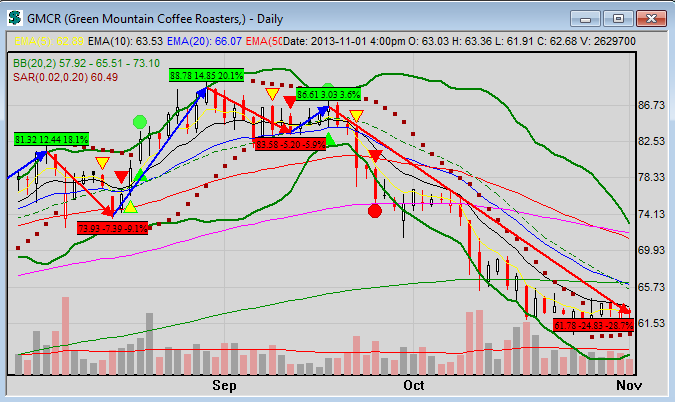
This chart is from August 2013 to October 2013. This is a good example on how you can cut loss by following ASTSS signals. ASTSS alerted buy signal on September 18, 2013. However it went down the next day. Fortunately ASTSS alerted stock trend down signal on September 25, 2013. If you bought this stock on September 18, 2013 at close price $86.61 and cut loss on September 25, 2013 at close price $75.82, your loss was 12%! This helped you not to loss more. The lowest price was once $60.15! |
|||||
|
|
|
Amazing Stock Trend Signal Software - The best accurate stock trend change and buy sell signal consultant!
|